Ask three mold inspectors what a normal spore count is and you can get three different answers. One flags anything above a fixed number, another compares your basement to the backyard, and a third says no number means anything on its own. Homeowners in Gettysburg and across south-central Pennsylvania end up holding a lab report full of figures with no clear way to tell whether they describe a healthy house or a problem.
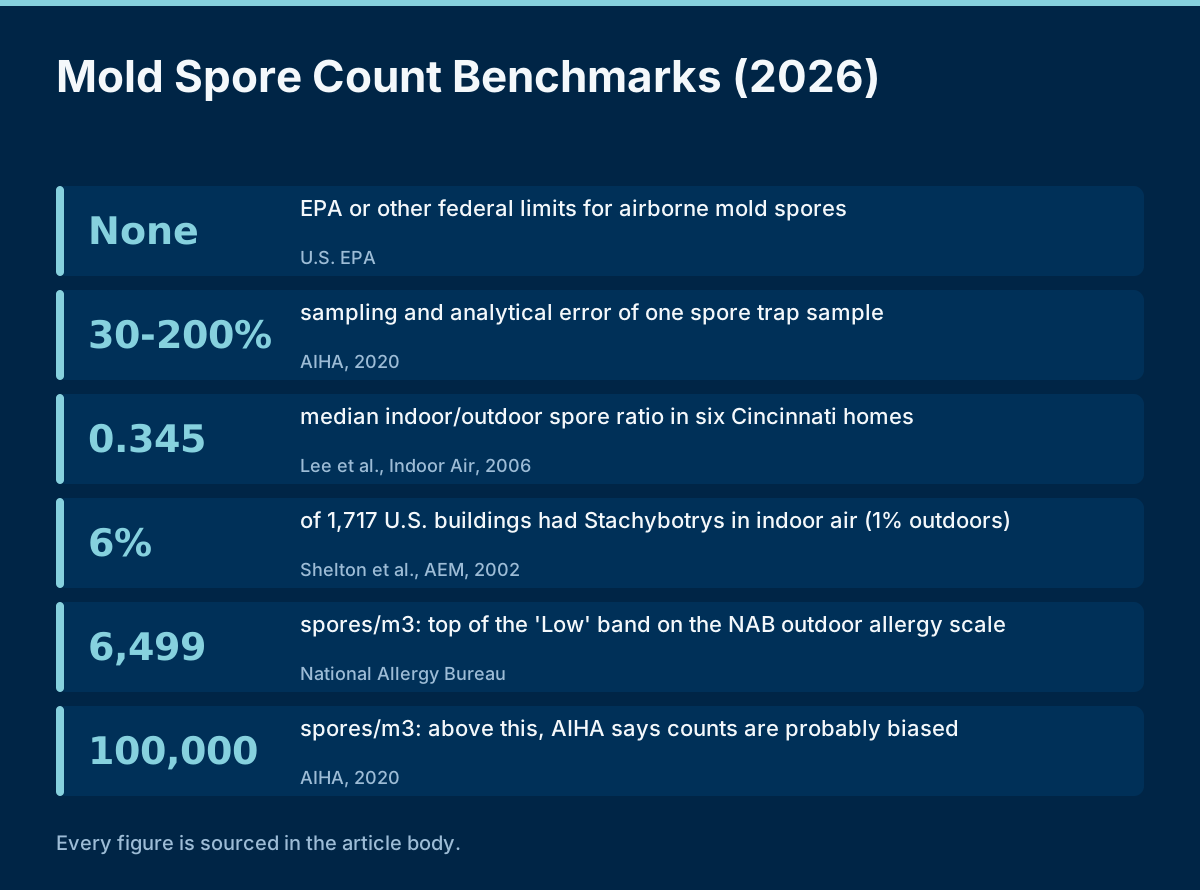
The reason is simple: there is no official line. The EPA states that no EPA or other federal limits have been set for mold or mold spores. What exists instead is a patchwork of research data, professional laboratory guidance, an outdoor allergy scale and private rules of thumb. Each was built for a different job, and they often get quoted as if they were interchangeable.
This guide puts every benchmark we could trace side by side, with its source, its year and what it was actually designed to measure. It also covers the part most reports never print: how far a single air sample can move. According to the American Industrial Hygiene Association, counts in the same room can swing as much as 10,000-fold over one day. Read the numbers below with that in mind.
No. The EPA says no federal limit exists for airborne mold, and no agency has set a health-based threshold for homes. AIHA guidance adds that air sampling cannot evaluate health risk at all, and that counts above 100,000 spores per cubic meter are probably biased.
| Metric | Value | Source |
|---|---|---|
| Federal limit for airborne mold spores | None | U.S. EPA, 2026 |
| Count above which results are probably biased (spores/m³) | 100,000 | AIHA, 2020 |
| Sampling and analytical error of one spore trap sample | 30% to 200% | AIHA, 2020 |
That absence matters more than it sounds. Without a legal or medical limit, every number on a report is being compared against something chosen by the person interpreting it. Sometimes that reference is sound, such as an outdoor control sample taken at the same time. Sometimes it is a figure borrowed from a different context entirely. The EPA's own advice is that sampling is often unnecessary when mold is already visible, and that it should be designed and interpreted by professionals following AIHA or ACGIH methods.
The AIHA position is stricter still. Its spore trap guidance says air samples are a screening tool that should support an informed inspection, not replace one, and that a sample can only show whether two environments differ. For the practical walk-through of a lab sheet, our guide to how to read mold test results covers the columns themselves. This page is about the numbers people compare those columns against.
The largest standardized U.S. study analyzed 12,026 air samples from 1,717 buildings and found indoor fungal levels lower than outdoor levels. In six Cincinnati homes, the median indoor-to-outdoor ratio for total spores was 0.345. Indoor air normally carries less mold than outdoor air.
| Metric | Value | Source |
|---|---|---|
| Air samples analyzed (U.S. buildings) | 12,026 | Shelton et al., Applied and Environmental Microbiology, 1998 |
| Buildings in that dataset | 1,717 | Shelton et al., 1998 |
| Buildings with Stachybotrys in indoor air | 6% | Shelton et al., 1998 |
| Buildings with Stachybotrys in outdoor air | 1% | Shelton et al., 1998 |
| Median indoor/outdoor ratio, total spores (six homes) | 0.345 | Lee et al., Indoor Air, 2005 |
| Median indoor/outdoor ratio, common outdoor genera | 0.65 to 0.91 | Tseng et al., Pathogens, 2021 |
These studies point to the one benchmark that holds up across datasets: in a building without an indoor source, indoor counts sit below outdoor counts and look like the same mix of types. The Shelton dataset found the most common airborne fungi indoors and outdoors were the same groups, led by Cladosporium and Penicillium, and that levels peaked in summer and fall. A smaller study of homes in Taiwan found median indoor-to-outdoor ratios of 0.65 to 0.91 for common outdoor genera, with Penicillium and yeast the exceptions that ran higher indoors.
Keep the limits in view. The Shelton samples were culture-based and collected in the late 1990s, and AIHA notes that culture results and spore trap results cannot be compared directly. The Cincinnati figure comes from only six houses. Still, the direction is consistent, and it matches the seasonal swing described in our guide to mold season in Pennsylvania: late summer and fall raise the outdoor baseline, so the same indoor number can mean different things in August and in February.
Inspection companies publish their own cut-offs, and they disagree. One flags totals above 1,500 spores per cubic meter or indicator species above 300. Another treats any indoor-to-outdoor ratio above 1:1 as actionable. None of these cut-offs traces to a published standard.
| Metric | Value | Source (vendor figure) |
|---|---|---|
| Indoor/outdoor ratio treated as actionable | 1:1 | Mold Smell Authority, industry reference site, 2026 |
| Indicator species cut-off (spores/m³) | 300 | Environix, mold testing company, 2025 |
| Per-type cut-off (spores/m³) | 500 | Environix, 2025 |
| Total-spore cut-off (spores/m³) | 1,500 | Environix, 2025 |
| Indoor count called a probable problem when outdoor is lower (spores/m³) | 2,200 | Ultimate Mold Crew, remediation company, 2026 |
| Indoor count called normal when outdoor is higher (spores/m³) | 800 | Sacramento Mold Experts, inspection company, 2026 |
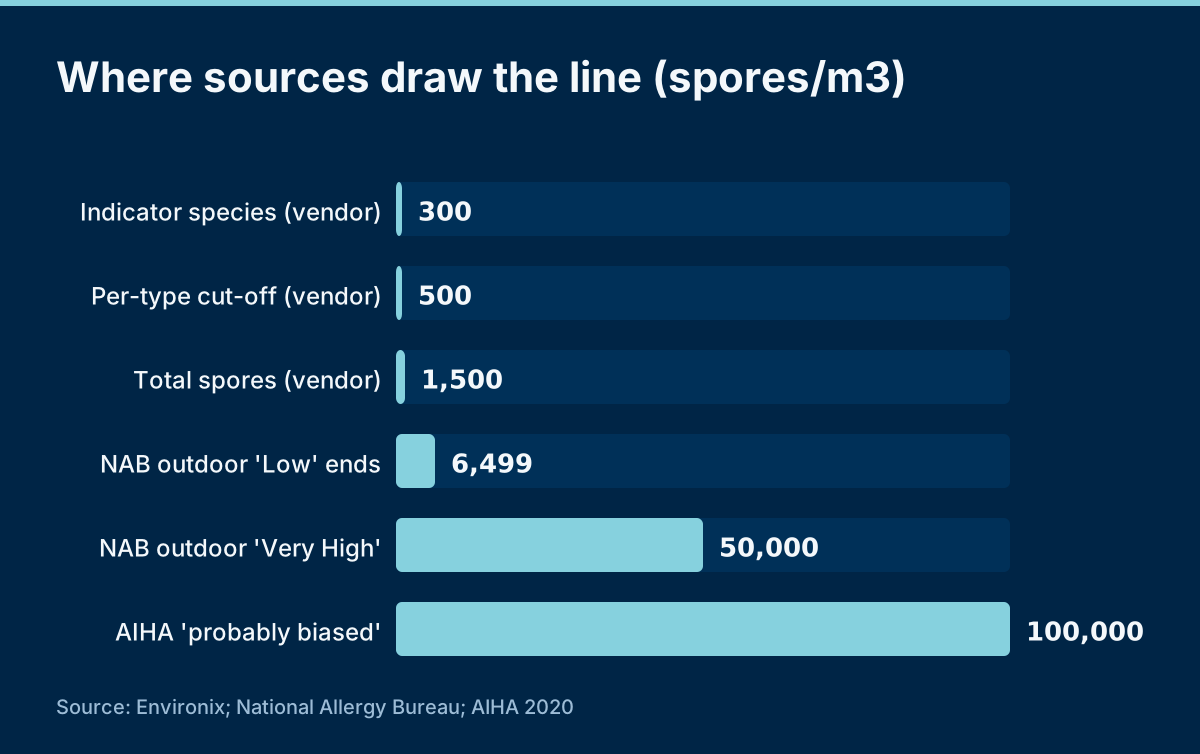
Put side by side, the rules show why homeowners get conflicting advice. A fixed cut-off ignores the outdoor control, while a pure ratio rule can flag a tight house on a dry winter day when the outdoor count is tiny. One remediation company's worked example calls an indoor reading of 2,200 a probable problem when outdoors read lower, while an inspection firm says an indoor reading of 800 can be perfectly normal when the outdoor baseline is higher. Both statements can be reasonable. They are answering different questions.
The ratio approach is usually attributed to the IICRC S520 remediation standard, which sorts conditions into normal fungal ecology, settled spores and actual growth. The standard itself is paywalled, so we could not confirm its exact wording. That is one reason to ask any inspector which rule produced their conclusion, and to prefer one who tracks down the moisture source rather than leaning on a single number. Our mold testing service reports the outdoor control, the type mix and the moisture readings together for that reason.
Those tiers come from the National Allergy Bureau outdoor allergy scale, built for daily pollen and mold forecasts. On it, outdoor mold from 0 to 6,499 spores per cubic meter is Low and 50,000 or more is Very High. It was never designed to judge the air inside a house.
| Outdoor allergy band | Spores/m³ |
|---|---|
| Low | 0 to 6,499 |
| Moderate | 6,500 to 12,999 |
| High | 13,000 to 49,999 |
| Very High | 50,000 and above |
National Allergy Bureau scale, via the St. Louis County Pollen and Mold Center, 2026.
This is the blind spot in most online charts. Several consumer sites present tiered tables running from low to very high that top out at roughly the same figure as the allergy scale, without saying the bands describe outdoor air on an allergy forecast. Applied to a home, the outdoor scale is far more relaxed than the vendor cut-offs in the previous section: a basement reading one inspector calls a problem would still sit comfortably inside the outdoor Low band.
Neither framing is a health threshold. The allergy scale describes how many sensitive people are likely to notice symptoms outdoors; the vendor cut-offs describe when a company recommends further work. If you are weighing whether a musty smell with no visible mold deserves testing, the useful comparison is still your indoor sample against an outdoor sample taken the same hour.
Because a spore trap is a short snapshot of a moving target. AIHA says samples typically run five to 15 minutes, carry 30% to 200% sampling and analytical error, and that counts in one room can vary as much as 10,000-fold across a single day.
| Metric | Value | Source |
|---|---|---|
| Within-day swing in one room | 10,000-fold | AIHA, 2020 |
| Sampling and analytical error, one spore trap | 30% to 200% | AIHA, 2020 |
| Typical sampling time, upper end | 15 minutes | AIHA, 2020 |
Activity, open doors, a furnace cycling on, fresh rain outdoors or someone walking past the pump can all move a result. AIHA guidance lists HVAC operation, outdoor weather, occupant activity and cleanliness among the variables, then adds that laboratories differ in counting and identification as well. Its recommendation is several samples per location, repeated over time, alongside a physical inspection. Most residential tests take one indoor sample per area and one outdoor control.
It is also why do-it-yourself plates and one-off tests produce so much confusion. Our breakdown of whether DIY mold test kits are accurate explains the settle-plate problem, and our comparison of air sampling versus surface sampling covers when a swab or tape lift answers the question better. After the work is done, clearance testing is most meaningful when it repeats the same method, location and outdoor control used beforehand.
Dust-based ERMI tests avoid the snapshot problem, but the EPA Office of Inspector General found in 2013 that EPA considered ERMI a research tool not validated for public use, while 10 licenses to the underlying technology were active. In one California study, randomly selected homes had a median ERMI of 2.
| Metric | Value | Source |
|---|---|---|
| Active licenses when EPA OIG reviewed the technology | 10 | U.S. EPA Office of Inspector General, 2013 |
| Median ERMI, randomly selected homes | 2 | Blanc et al., Environmental Research, 2013 |
| Median ERMI, homes of adults with asthma or rhinitis | 6 | Blanc et al., 2013 |
| Homes sampled in HUD's second healthy homes survey | 695 | U.S. EPA Office of Research and Development, 2019 |
ERMI scores a home by comparing DNA from water-damage molds against common outdoor molds in settled dust. Researchers found higher scores in the homes of adults with airway disease, a median of 6 against 2 in comparison homes, and EPA researchers later used a national survey of 695 homes to show older homes tend to score higher. That makes ERMI a solid research index. It does not make any single score a pass or fail line for your house.
For buyers on a deadline, dust tests also take longer than a spore trap. If you are inside a contingency window, our notes on mold inspections before buying a home and on what mold testing costs in Gettysburg help you choose a method that fits both the schedule and the question you need answered.
We compiled every benchmark we could trace for interpreting indoor mold air tests: federal guidance from the EPA, professional laboratory guidance from AIHA, peer-reviewed studies of indoor and outdoor fungal levels, the National Allergy Bureau outdoor scale, EPA Inspector General and EPA research records on ERMI, and published rules of thumb from inspection and remediation companies, which are labeled above as vendor figures. Every value was checked against its source on 2 October 2026. Three journal sources block automated access, so their figures were confirmed against the Europe PMC abstract records for the same papers. The IICRC S520 standard is paywalled and is cited only as described by a secondary source.
The limits are worth stating plainly. No U.S. agency or professional body publishes a numeric indoor spore limit, so this page reports research distributions, professional guidance and vendor rules of thumb rather than a standard. The largest U.S. dataset is culture-based and was collected in the late 1990s, and culture results and spore trap results are not directly comparable. The indoor-to-outdoor ratio studies are small, covering six homes in Cincinnati and a set of homes in Taiwan. We found no Pennsylvania-specific indoor spore dataset. We review this page annually, or whenever AIHA, EPA or IICRC guidance changes.
A spore count is only worth what the sampling and the interpretation behind it are worth. If you have a report and are not sure what it means, or a kit result with no outdoor control, we will walk through it with you. Our team handles mold remediation in Gettysburg, PA and reports the outdoor control, the spore types and the moisture readings together, so the conclusion does not rest on one number. Call (717) 420-8919, 24 hours a day.